Thomson Reuters Foundation – Spotted Cat Challenge
(with the Zoological Society of London)
G.W. Haddad and S.C. Kefauver
(Third Place Prize)
Background
We started off separately with two different schools of thought, one on the theoretical side and the other on the practical side.
On the theoretical side were ideas of using HoughCircles, 2D balloon segmentation and trainable Weka segmentation. On the practical side there were ideas of using template matching and counting number of spots matched. None of the ideas fully satisfied the detection of spotted cats in the large set of images.
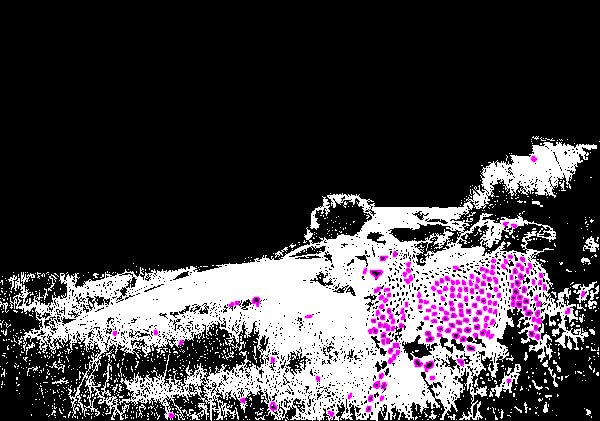
Putting both trains of thought together a joint solution was reached. An idea from the biomedical field to preprocess images of bacteria in order to count the number of cells gave way to the first part of this solution. The images were to be similarly preprocessed to bring out the spot patterns. These spots were to be detected much like cells in a petri dish under a microscope. At the same time, a large set of data would be collected about the detected spots which would then be analyzed to find a statistical model using R scripts that optimally analyzed the images as according to the detailed characteristics of the detected spots.
Further investigation of the data produced by the Spotted Catatalyst revealed the need for a imbalanced data binary classification solution. A comparison of the suitable models is presented, including AIC-optimized logistic regression (“MASS”), Random Over Sampling Examples (“ROSE”) applications to recursive partitioning with “rpart,” and stratified random recursive partitioning with “randomForest.” A shortened version of the R script used for the “randomForest rfc3” model case, which we feel is an optimal solution for this project, is provided in Appendix III. It has been tailored to train on the 25k+ manually quality controlled spotted cat images and set to run a prediction using the randomForest model directly on the output of the Spotted Catalyst plugin.
Technical
Fiji (http://fiji.sc/Fiji) is the main tool for image analysis of the spotted cat images. Fiji is an image processing package with many plugins that do specific scientific analysis. The tool is licensed under the GPL and each and every one of the plugins has their own license which can be listed here (https://github.com/fiji/fiji/blob/master/LICENSES)

A custom plugin has been developed to process large batches of images and perform pre-processing operations, particle analysis and consolidate the results to a comma separated value (CSV) file. It accepts images of type JPEG and will also accept a larger variety of images supported by Fiji such as PNG and TIFF to name a few.
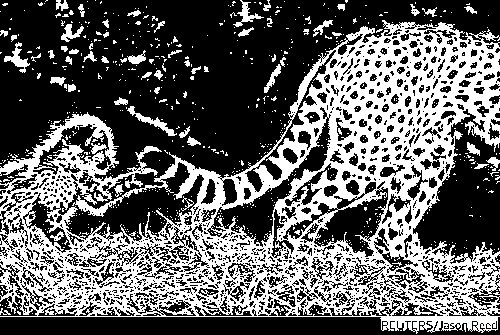
Preprocessing Steps
- Enhance local contrast (CLAHE)
- Convert image to 8bit grayscale
- Subtract background
- Adjust image threshold (Black&White)
- Convert image to mask
Analysis Steps
- Set measurements that are needed
- Set the min & max particle size
- Set the min & max particle circularity
- Analyze the image (1 or 2 passes with different size & circularity options
- Save an overlay of the detected particles (optional)
Having a metadata file provided can be useful in enhancing the preprocessing steps since each image has a “daytime” flag. This allows us to give the user the choice to adjust the following values based on the “daytime” flag. Should there be no metadata file available then a single value is used for all images.
- Subtract Background
- Rolling value for Daytime
- Rolling value for Nighttime
- Enhance Local Contrast (CLAHE)
- Maximum slope for Daytime
- Maximum slope for Nighttime
Due to the fact that not all the images have a very clear picture of a spotted cat, there was the need to perform several analysis passes on each image to cover various cases. There are 2 such cases that are currently covered:
- Spotted cat with visibly large spots
- The cat is up close and personal with the camera
- Spots on cat are not physically obstructed
- Spotted cat with visibly small spots
- That is far away in the distance
- Camera flash is too bright and causes spots to look smaller
- Spots are obstructed by objects
- Too little light on the cat to display spots
The user can define 1 or 2 analysis passes on each image. Each pass the user can define the following variables:
- Minimum particle size (in pixels)
- The smallest diameter of a particle
- Maximum particle size (in pixels)
- The largest diameter of a particle (largest value can be positive infinity)
- Minimum particle circularity (0.0 – 1.0)
- How circular the particle is allowed to be where 0.0 is not circular at all and 1.0 is a perfect circle
- Maximum particle circularity
- The maximum end of the circularity of a particle
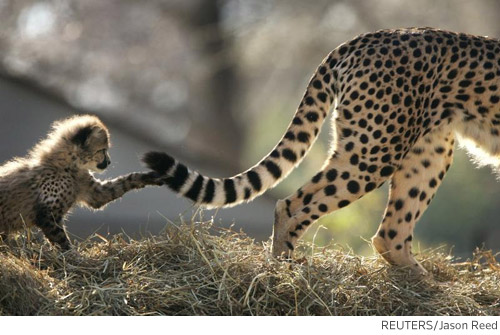
With an optimal configuration of particle size and circularity we can accurately detect spots on an image without detecting other shapes that may appear. Having the image preprocessed allows us to clear up any garbage in the background so that the particle analysis stage can detect the most relevant particles. Background removal works well since the images are produced by motion sensor detection cameras and, as such the cats are usually in the image foreground.
Plugin Performance
The requirements of processing 1,000 images are far exceeded by the plugin. As performed on the benchmark below it can process on average 377 images per minute on a slightly better than average laptop. The entire set of 50,642 images has taken 2.2 hours.